| GINO Graphics Suite - GINOGRAF v9.5 |  |
 |
| GINO Graphics Suite - GINOGRAF v9.5 | |
|
In addition to the standard numerical axes provided by GINOGRAF, the library also provides a means of handling date data and displaying date axes of various formats. In order to integrate date data into the graph displaying features of GINOGRAF, dates are converted onto a numeric scale where the start of the Gregorian calendar (September 13th 1752) is equivalent to 1.0.
Dates are input as a character string of up to 10 characters, the delimiter between days, months and years is the forward oblique stroke "/". Days and months can be given as one or two digits, with an optional leading zero for values less than 10. Years are given as two or four digits. If only two digits are given, they are assumed to apply to the range 1950 to 2049. ie. 05 is treated as 2005 and not 1905. Leading and trailing spaces are ignored. Examples of valid date forms are:
31/12/95The default ordering of day, month, year is the British form, but the American and reverse forms can be used by setting the date input format type using the routine ggSetDateFormat():
ggSetDateFormat(inform,insep,ouform,ousep)where inform and ouform are either GBRITISH, GAMERICAN or GLOGICAL.
The user can define either the X(horizontal) or Y(vertical) axis of a graph to be a date axis using the routine ggSetDateAxesScaling():
ggSetDateAxesScaling(scale,dincr,dbeg,dend,xory)Three scale types are permitted to cater for different end conditions required by the user in conjunction with the specified increment type (as set in dincr). Unlike the numerical axes, the user specifies the type of increment required for the date axes in terms of decade, year, month etc., rather than the number of increments. The start and end points of the date axes are defined in the character strings dbeg and dend as described above.
As with numerical axes, date axes are positioned using the routine ggSetAxesPos() and displayed using the axes drawing routine ggDrawAxes(). They are also divided into a number of increments separated by major tick marks, which for the date axes represents the specified increment type selected by ggSetDateAxesScaling(). The axes may include minor tick marks representing the next smaller increment type according to the argument of ggDrawAxes(). Labels are (optionally) drawn at each major tick mark according to the current date output format as defined by the routine ggSetDateAxesAnnotation():
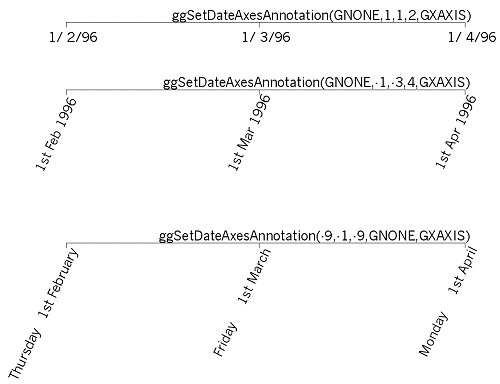
ggSetDateAxesAnnotation(fdow,fday, fmon,fyear,xory)where the first four arguments specify the requirement and/or format of each component of the date to be output. Each of the 'day of the week', day or months may be output alphanumerically or numerically and different output formats may be specified for each of the X or Y axes.
Examples of some of the different output formats are shown below.
 |
Date axes output |
Where either of the X or Y axis has been defined as a date axis using the routine ggSetDateAxesScaling(), GINOGRAF defines an internal numerical scaling for the range of dates used for the axes based on the Gregorian calendar as described above.
It is necessary therefore to convert 'date' data to this numerical scale so that the various graph and chart output forms described later in this manual can be used with the date axes. A single routine is provided for this purpose, to convert an array of date data into its equivalent numeric values.
ggConvertDates(ndates,dates,data)where dates is a character array containing ndates dates in the current date input format, returning the numerical values in data.
Single dates may be converted to and from their numerical values using the following routines:
ggConvertDateToGraph(date,value)Two examples show the usage of date axes:
Example 1 - The user has an array of dates and numeric values which need to be plotted on date axes.
The following input data represents maximum and minimum temperature readings:
01/01/2011 3 -1The following code segment reads in the data, sets up the date axes and converts the data ready for graph drawing:
[C/C++]
#define MAX_DATA 100
  char  *Dates[MAX_DATA];
  float X[MAX_DATA];
  FILE  *ifp;
  int   n, stat, Max[MAX_DATA],Min[MAX_DATA];

/* Allocate space for dates MAX_DATA times */
  for (n=0; n<MAX_DATA; n++)
    Dates[n]=(char*)malloc(9*sizeof(char));

/* READ IN TEMPERATURE DATA */
  if (!(ifp = fopen("temps.dat","r"))) return 1;
  n=0;
  stat=fscanf(ifp,"%s%d%d", Dates[n],&Max[n],&Min[n]);
  while (stat!=EOF) {
    n++;
    stat=fscanf(ifp,"%s%d%d\n",Dates[n],&Max[n],&Min[n]);
  }
  fclose(ifp);

/* DEFINE DATE AXES */
  ggSetDateAxesScaling(1,GDAY,Dates[0],Dates[n-1],GXAXIS);

/* DRAW DATE AXES */
  ggDrawAxes(GCARDINAL,GCLOCKWISE,GCLOCKWISE,GXAXIS);

/* CONVERT DATE DATA FOR PLOTTING AGAINST X AXIS */
  ggConvertDates(n,Dates,X);
[F90]
 integer, parameter :: MAX_DATA=100
   character (len=8), dimension(MAX_DATA) :: Dates
   real X(MAX_DATA)
   integer n,Max(MAX_DATA),Min(MAX_DATA)

! READ IN TEMPERATURE DATA
   open(unit=11,file='TEMPS.DAT')
   n=0
10 read(11,11,end=20) Dates(n+1),Max(n+1),Min(n+1)
11 format(A,2I4)
   n=n+1
   goto 10

! DEFINE DATE AXES
20 call ggSetDateAxesScaling(1,GDAY,Dates(1),&
     Dates(n),GXAXIS)

! DRAW DATE AXES
   call ggDrawAxes(GCARDINAL,GCLOCKWISE,GCLOCKWISE,GXAXIS)

! CONVERT DATE DATA FOR PLOTTING AGAINST X AXIS
   call ggConvertDates(n,Dates,X)
Example 2 - The user has numeric data which actually represents date data and needs to be displayed on date axes. This can be handled in one of two ways; either all the data can be handled numerically superimposing a date axis over the numeric axis, or you can convert the numeric data to the required date scale. For example, if the following data represents 2011 monthly shoe sales:
1 223The following code segment sets up and draws a date axis and superimposes a numeric axis with the same number of intervals over it to do the plotting of the graph:
[C/C++]
   int month[12],sales[12];
   FILE *ifp;
   int n, stat;

/* READ IN SHOE SALES DATA */
   if (!(ifp=fopen("shoe.dat","r"))) return 1;
   n=0;
   stat=fscanf(ifp,"%d%d", &month[n],&sales[n]);
   while (stat!=EOF) {
     n++;
     stat=fscanf(ifp,"%d%d",&month[n],&sales[n]);
   }
   fclose(ifp);

/* DEFINE AND DRAW DATE AXES FOR SALES PERIOD */
   ggSetDateAxesScaling(3,GMONTH,"01/01/11","01/12/11",GXAXIS);
   ggDrawAxes(GCARDINAL,GCLOCKWISE,GCLOCKWISE,GXAXIS);

/* RE-DEFINE NUMERIC SCALING FOR SALES PERIOD */
   ggSetAxesScaling(GLINEARTYPE3,11,1.0,12.0,GXAXIS);

/* PLOT DATA ACCORDING TO NUMERIC SCALING */
[F90]
  integer month(12),sales(12)
  integer n

!  READ IN SHOE SALES DATA
   open(unit=11,file='SHOE.DAT')
   n=0
10 read(11,*,end=20) month(n+1),sales(n+1)
   n=n+1
   goto 10

!  DEFINE AND DRAW DATE AXES FOR SALES PERIOD
20 call ggSetDateAxesScaling(3,GMONTH,'01/01/11','01/12/11',GXAXIS)
   call ggDrawAxes(GCARDINAL,GCLOCKWISE,GCLOCKWISE,GXAXIS)

!  RE-DEFINE NUMERIC SCALING FOR SALES PERIOD
   call ggSetAxesScaling(GLINEARTYPE3,11,1.0,12.0,GXAXIS)

!  PLOT DATA ACCORDING TO NUMERIC SCALING
And the following code would use just date axes and convert the data appropriately using ggConvertDates():
[C/C++]
   int month[100],sales[100];
   char *mon[100];
   int n, i, stat, m1, m2;

/* Allocate space for dates */
   for (n=0; n<100; n++)
      Mons[n]=(char*)malloc(9*sizeof(char));

/* READ IN SHOE SALES DATA */
   if (!(ifp=fopen("shoe.dat","r"))) return 1;
   n=0;
   stat=fscanf(ifp,"%d%d",&month[n],&sales[n]);
   while (stat!=EOF) {
     n++;
     stat=fscanf(ifp,"%d%d",&month[n],&sales[n]);
   }
   fclose(ifp);

/* CONVERT MONTH NO. TO DATE SCALING */
   for (i=0;i<n; i++) {
     m1=(int)(month(i))/10;
     m2=(int)(month(I))%10;
     sprintf(mon(i), "01/%d%d/11", m1+48, m2+48);
   }
   ggConvertDates(n,mon,month);

/* DEFINE AND DRAW DATE AXES FOR SALES PERIOD */
   ggSetDateAxesScaling(3,GMONTH,"01/01/11","01/12/11",GXAXIS);
   ggDrawAxes(GCARDINAL,GCLOCKWISE,GCLOCKWISE,GXAXIS);

/* PLOT DATA ACCORDING TO DATE AXES SCALING */
[F90]
    integer month(100),sales(100)
    character (len=8), dimension(100) :: mon
    integer n, i

! READ IN SHOE SALES DATA
    open(unit=11,file='SHOE.DAT')
    n=0
10  read(11,*,end=20) month(n+1),sales(n+1)
    n=n+1
    goto 10

! CONVERT MONTH NO. TO DATE SCALING
20  DO 30 I=1,N
       m1=int(month(i))/10
       m2=mod(int(month(i)),10)
       mon(i)='01/' // char(m1+48) // char(m2+48)// '/11'
30  continue
    call ggConvertDates(n,mon,month)

! DEFINE AND DRAW DATE AXES FOR SALES PERIOD
    call ggSetDateAxesScaling(3,GMONTH,'01/01/11','01/12/11',GXAXIS)
    call ggDrawAxes(GCARDINAL,GCLOCKWISE,GCLOCKWISE,GXAXIS)

! PLOT DATA ACCORDING TO DATE AXES SCALING
Both programs produce exactly the same output.
Note that GINOGRAF always draws axes with equally spaced tickmarks and therefore date intervals of 'month' or 'year' are not drawn at exactly the correct 'daily' position because of the unequal number of days in each of those intervals.
The current date axis settings can be enquired though the following three routines:
ggEnqDateFormat(inform,insep,ouform,ousep)